数据库监控需要监控哪些指标呢?
文章目录
- 1. 对数据库服务可用性进行监控
- 2. 对数据库性能进行监控
- 1. 周期性获取QPS和TPS
- 2. 如何监控innodb的阻塞
- 3. 监控buffer pool
- 4. 监控binlog是否使用了磁盘
- 5. 监控写的能力
- grafana mysql dashboard
- 1. Uptime
- 2. Current QPS
- 3. InnoDB Buffer Pool Size
- 4. Connections
- Connections
- Max Used Connections
- Max Connections
- 5. Client Thread Activity
- Peak Threads Connected
- Peak Threads Running
- Avg Threads Running
- 6. Mysql Questions
- 7. Mysql Thread Cache
- Thread Cache Size
- Threads Cached
- Threads Created
- 8. Temporary Objects
- Created Tmp Tables
- Created Tmp Disk Tables
- Created Tmp Files
- 9. Mysql Select Type
- Select Scan
- Select Full Join
- Select Range
- Select Range Check
- Select Full Range Join
- 10. Mysql Sort
- Sort Rows
- Sort Scan
- Sort Range
- Sort Merge Passes
- 11. Mysql Slow Query
- 12. Mysql Abort Connections
- Aborted Connects (attempts)
- Aborted Clients (timeout)
- 13. Mysql Table Lock
- Table Locks Immediate
- Table Locks Waited
- 14. Mysql Network Traffic
- Inbound
- Outbound
- 15. Mysql Network Usage Hourly
- Received
- Sent
- 16. Mysql Internal Memory Overview
- InnoDB Buffer Pool Data
- 17. Top Command Counters
- 18. Top Command Counters Hourly
- 19. Mysql Handler
- 20. Mysql Transaction Handler
- 21. Process States
- 23. Mysql Query Cache Memory
- Free Memory
- Query Cache Size
- 26. Mysql Open Files
- Open Files
- Open Files Limit
- InnoDB Open Files
- 27. Mysql Table Open Cache Status
- Openings
- Hits
- Misses
- Misses due to Overflows
- Table Open Cache Hit Ratio
- 28. Mysql Open Tables
- Open Tables
- Table Open Cache
- 29. Mysql Table Definition Cache
- Opened Table Definitions(right-y)
- Table Definitions Cache Size
- Open Table Definitions
- 3. 对主从复制进行监控
- 4. 对服务器资源的监控,如磁盘空间
1. 对数据库服务可用性进行监控
数据库进程或是端口存在,并不意味着数据库就能提供服务
要通过网络对数据库进行连接,并执行某些简单的数据库脚本(health check)
mysqladmin -umonitor_user -p -hip地址 ping
telnet ip db_port 手动来连接
可以连接数据库并不代表数据库可用
确认数据库是否可以读写
检查数据库的read_only参数是否为off,从服务器read_only参数最好打开,主从切换后可能忘记改回来了
建立监控表并对表中数据进行更改
执行简单的查询select @@version,来判断数据库是否可读
存在tcp/ip连接被占满的情况
出现阻塞或memcache大量缓存失效
show variables like 'max_connections'
show global status like 'threads_connected'
threads_connected/max_connections > 0.8就要报警了
2. 对数据库性能进行监控
1. 周期性获取QPS和TPS
QPS = (Queries2 - Queries1)/(Uptime_since_flush_status2-Uptime_since_flush_status1)

TPS = ((Com_insert2 + Com_update2 + Com_delete2) - (Com_insert1 + Com_update1 + Com_delete1)) / (Uptime_since_flush_status2 - Uptime_since_flush_status1)
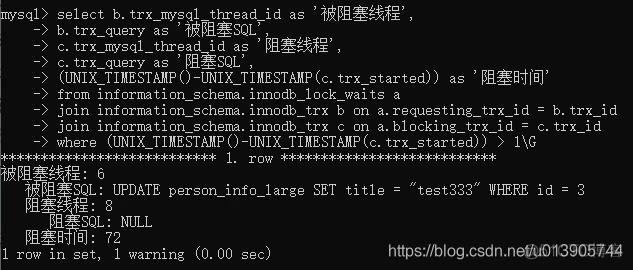
2. 如何监控innodb的阻塞
查出阻塞时间大于60秒的语句
select b.trx_mysql_thread_id as '被阻塞线程',
b.trx_query as '被阻塞SQL',
c.trx_mysql_thread_id as '阻塞线程',
c.trx_query as '阻塞SQL',
(UNIX_TIMESTAMP()-UNIX_TIMESTAMP(c.trx_started)) as '阻塞时间'
from information_schema.innodb_lock_waits a
join information_schema.innodb_trx b on a.requesting_trx_id = b.trx_id
join information_schema.innodb_trx c on a.blocking_trx_id = c.trx_id
where (UNIX_TIMESTAMP()-UNIX_TIMESTAMP(c.trx_started)) > 1;
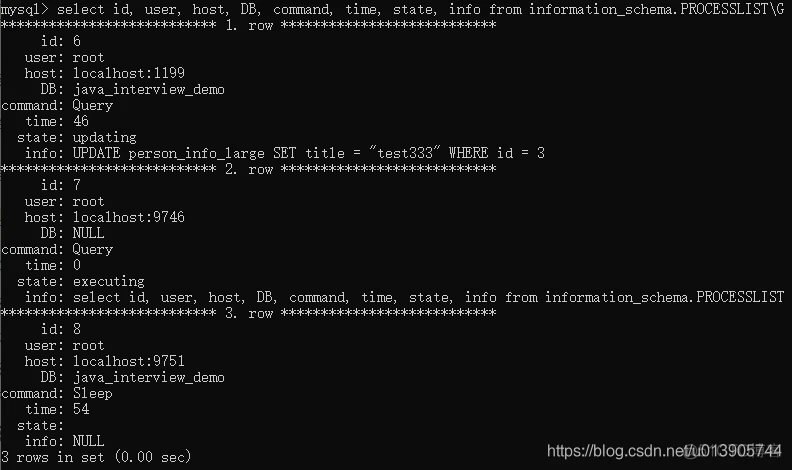
select id, user, host, DB, command, time, state, info from information_schema.PROCESSLIST\G
通过在session1上执行
select connection_id();获得id
3. 监控buffer pool
select * from information_schema.INNODB_BUFFER_POOL_STATS\Gfree_buffers接近为0,database_pages接近pool_size的值,说明数据库压力很大。
4. 监控binlog是否使用了磁盘
监控的时候可以看一下binlog_cache_disk_use这个值是否比较大,如果比较大,那说明binlog cache可能不够大
5. 监控写的能力
innodb_io_capacity,默认是200。这个参数控制多少个脏页触发checkpoint,以这个参数很重要,值大一点,那么写的能力就会提高起来,但如果值很大,那么可能就会hang住
这个参数是innodb调优需要很关注,但是很容易忽略的一个点
grafana mysql dashboard
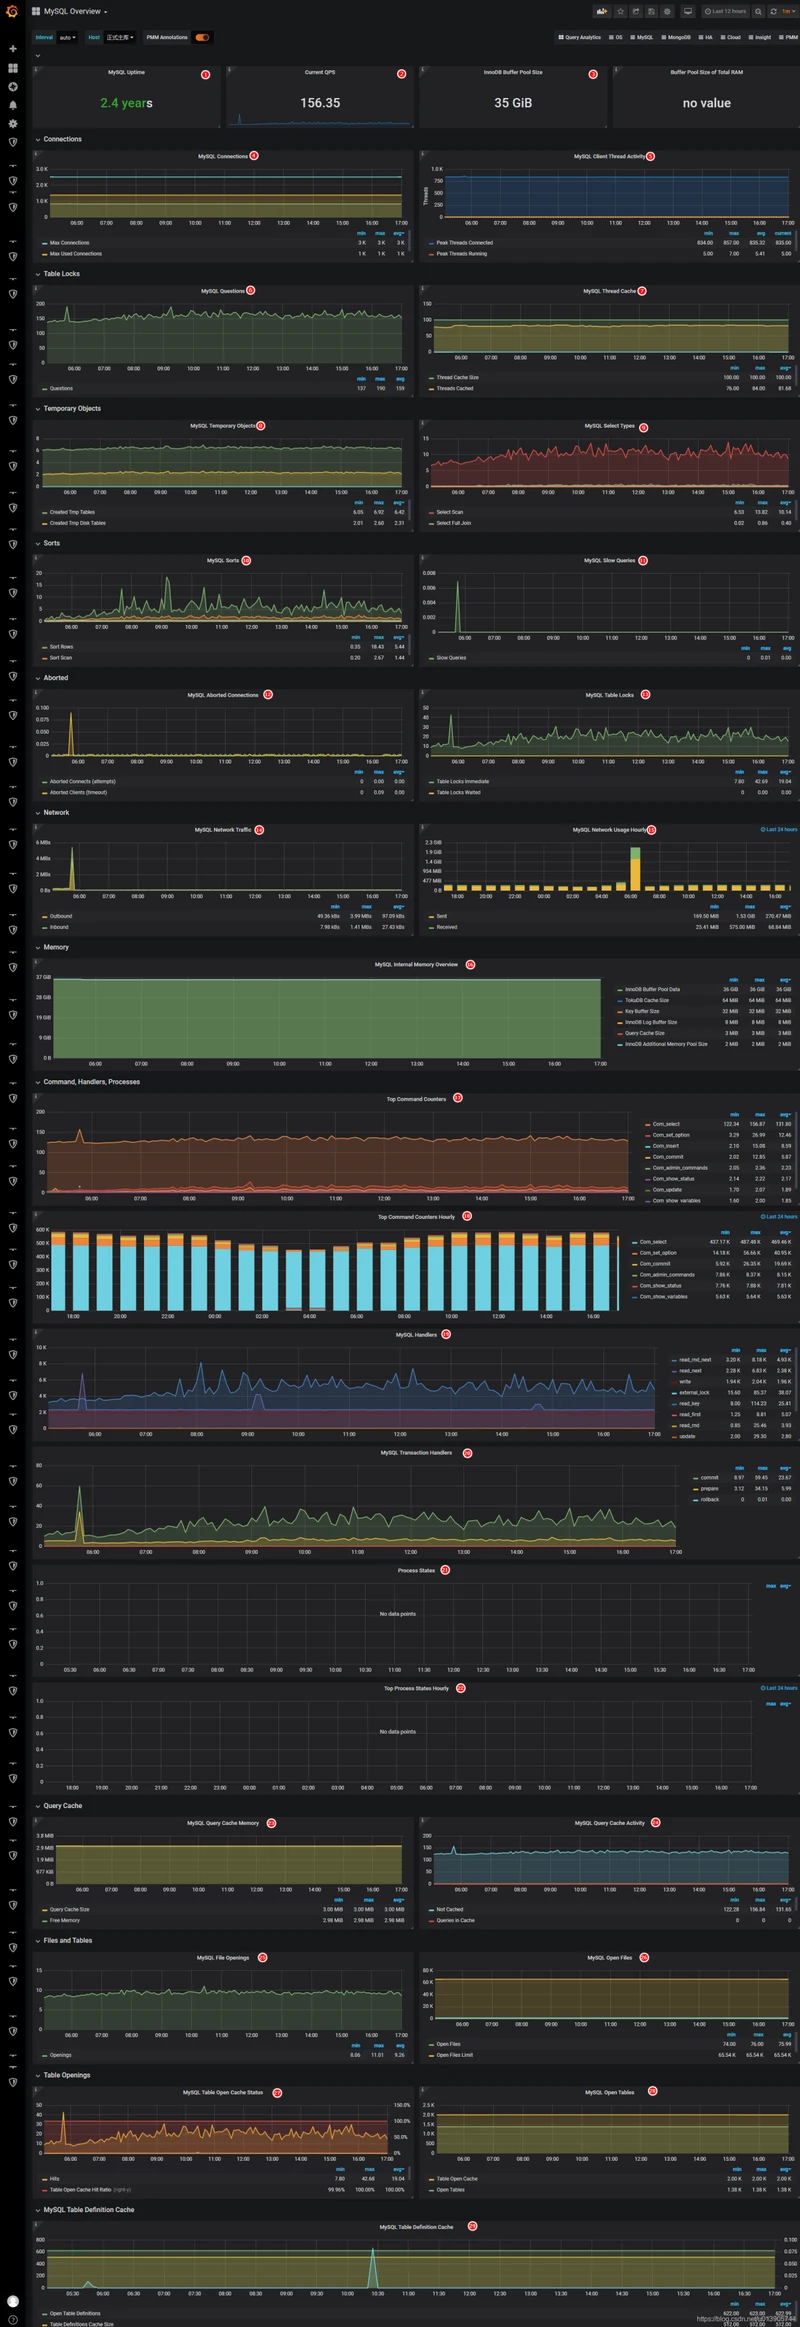
以下面这个grafana mysql dashboard为例说明

完整效果

1. Uptime
SHOW GLOBAL STATUS LIKE '%Uptime%';Uptime
The number of seconds that the server has been up.2. Current QPS
SHOW GLOBAL STATUS LIKE '%queries%';Queries
The number of statements executed by the server. This variable includes statements executed within stored programs, unlike the Questions variable. It does not count COM_PING or COM_STATISTICS commands.
The discussion at the beginning of this section indicates how to relate this statement-counting status variable to other such variables.grafana中
rate(mysql_global_status_queries{instance="$host"}[$interval]) or irate(mysql_global_status_queries{instance="$host"}[5m])3. InnoDB Buffer Pool Size
mysql 缓冲池 buffer pool 所占大小
4. Connections
Connections
SHOW GLOBAL STATUS LIKE '%threads_connected%';Threads_connected
The number of currently open connections.grafana统计规则是:
max(max_over_time(mysql_global_status_threads_connected{instance="$host"}[$interval]) or mysql_global_status_threads_connected{instance="$host"} )Max Used Connections
SHOW GLOBAL STATUS LIKE '%max_used_connections%';Max_used_connections
The maximum number of connections that have been in use simultaneously since the server started.
Max_used_connections_time
The time at which Max_used_connections reached its current value.grafana统计规则是:
mysql_global_status_max_used_connections{instance="$host"}Max Connections
SHOW GLOBAL VARIABLES LIKE '%max_connections%';--max-connections=#max_connections1511100000The maximum permitted number of simultaneous client connections. For more information, see Section 5.1.11.1, “Connection Interfaces”.
grafana统计规则是:
mysql_global_variables_max_connections{instance="$host"}5. Client Thread Activity
Peak Threads Connected
SHOW GLOBAL STATUS LIKE '%threads_connected%';Threads_connected
The number of currently open connections.grafana统计规则:
max_over_time(mysql_global_status_threads_connected{instance="$host"}[$interval]) or
max_over_time(mysql_global_status_threads_connected{instance="$host"}[5m])
Peak Threads Running
SHOW GLOBAL STATUS LIKE '%threads_running%';Threads_running
The number of threads that are not sleeping.grafana统计规则:
max_over_time(mysql_global_status_threads_running{instance="$host"}[$interval]) or
max_over_time(mysql_global_status_threads_running{instance="$host"}[5m])
Avg Threads Running
grafana统计规则:
avg_over_time(mysql_global_status_threads_running{instance="$host"}[$interval]) or
avg_over_time(mysql_global_status_threads_running{instance="$host"}[5m])
6. Mysql Questions
SHOW GLOBAL STATUS LIKE '%questions%';grafana统计规则
rate(mysql_global_status_questions{instance="$host"}[$interval]) or irate(mysql_global_status_questions{instance="$host"}[5m])7. Mysql Thread Cache
Thread Cache Size
SHOW GLOBAL VARIABLES LIKE '%thread_cache_size%';--thread-cache-size=#thread_cache_size-1016384How many threads the server should cache for reuse. When a client disconnects, the client’s threads are put in the cache if there are fewer than thread_cache_size threads there. Requests for threads are satisfied by reusing threads taken from the cache if possible, and only when the cache is empty is a new thread created. This variable can be increased to improve performance if you have a lot of new connections. Normally, this does not provide a notable performance improvement if you have a good thread implementation. However, if your server sees hundreds of connections per second you should normally set thread_cache_size high enough so that most new connections use cached threads. By examining the difference between the Connections and Threads_created status variables, you can see how efficient the thread cache is. For details, see Section 5.1.9, “Server Status Variables”.
The default value is based on the following formula, capped to a limit of 100:
8 + (max_connections / 100)libmysqldgrafana统计规则
mysql_global_variables_thread_cache_size{instance="$host"}Threads Cached
SHOW GLOBAL STATUS LIKE '%threads_cached%';The number of threads in the thread cache.
libmysqldgrafana统计规则
mysql_global_status_threads_cached{instance="$host"}Threads Created
SHOW GLOBAL STATUS LIKE '%threads_created%';The number of threads created to handle connections. If Threads_created is big, you may want to increase the thread_cache_size value. The cache miss rate can be calculated as Threads_created/Connections.
miss cache rate = 9320/7672870 = 0.1%
grafana统计规则
rate(mysql_global_status_threads_created{instance="$host"}[$interval]) or irate(mysql_global_status_threads_created{instance="$host"}[5m])8. Temporary Objects
Created Tmp Tables
SHOW GLOBAL STATUS LIKE '%created_tmp_tables%';The number of internal temporary tables created by the server while executing statements.
You can compare the number of internal on-disk temporary tables created to the total number of internal temporary tables created by comparing the values of the Created_tmp_disk_tables and Created_tmp_tables variables.
Each invocation of the SHOW STATUS statement uses an internal temporary table and increments the global Created_tmp_tables value.
grafana统计规则
rate(mysql_global_status_created_tmp_tables{instance="$host"}[$interval]) or irate(mysql_global_status_created_tmp_tables{instance="$host"}[5m])Created Tmp Disk Tables
SHOW GLOBAL STATUS LIKE '%created_tmp_disk_tables%';The number of internal on-disk temporary tables created by the server while executing statements.
If an internal temporary table is created initially as an in-memory table but becomes too large, MySQL automatically converts it to an on-disk table. The maximum size for in-memory temporary tables is the minimum of the tmp_table_size and max_heap_table_size values. If Created_tmp_disk_tables is large, you may want to increase the tmp_table_size or max_heap_table_size value to lessen the likelihood that internal temporary tables in memory will be converted to on-disk tables.
You can compare the number of internal on-disk temporary tables created to the total number of internal temporary tables created by comparing the values of the Created_tmp_disk_tables and Created_tmp_tables variables.
grafana统计规则
rate(mysql_global_status_created_tmp_disk_tables{instance="$host"}[$interval]) or irate(mysql_global_status_created_tmp_disk_tables{instance="$host"}[5m])Created Tmp Files
SHOW GLOBAL STATUS LIKE '%created_tmp_files%';How many temporary files mysqld has created.
grafana统计规则
rate(mysql_global_status_created_tmp_files{instance="$host"}[$interval]) or irate(mysql_global_status_created_tmp_files{instance="$host"}[5m])9. Mysql Select Type
Select Scan
SHOW GLOBAL STATUS LIKE '%select_scan%';The number of joins that did a full scan of the first table.
grafana
rate(mysql_global_status_select_scan{instance="$host"}[$interval]) or irate(mysql_global_status_select_scan{instance="$host"}[5m])Select Full Join
SHOW GLOBAL STATUS LIKE '%select_full_join%';The number of joins that perform table scans because they do not use indexes. If this value is not 0, you should carefully check the indexes of your tables.
grafana
rate(mysql_global_status_select_full_join{instance="$host"}[$interval]) or irate(mysql_global_status_select_full_join{instance="$host"}[5m])Select Range
SHOW GLOBAL STATUS LIKE '%select_range%';The number of joins that used ranges on the first table. This is normally not a critical issue even if the value is quite large.
grafana
rate(mysql_global_status_select_range{instance="$host"}[$interval]) or irate(mysql_global_status_select_range{instance="$host"}[5m])Select Range Check
SHOW GLOBAL STATUS LIKE '%select_range_check%';The number of joins without keys that check for key usage after each row. If this is not 0, you should carefully check the indexes of your tables.
grafana
rate(mysql_global_status_select_range_check{instance="$host"}[$interval]) or irate(mysql_global_status_select_range_check{instance="$host"}[5m])Select Full Range Join
SHOW GLOBAL STATUS LIKE '%select_full_range_join%';The number of joins that used a range search on a reference table.
grafana
rate(mysql_global_status_select_full_range_join{instance="$host"}[$interval]) or irate(mysql_global_status_select_full_range_join{instance="$host"}[5m])10. Mysql Sort
Sort Rows
SHOW GLOBAL STATUS LIKE '%sort_rows%';The number of sorted rows.
grafana
rate(mysql_global_status_sort_rows{instance="$host"}[$interval]) or irate(mysql_global_status_sort_rows{instance="$host"}[5m])Sort Scan
SHOW GLOBAL STATUS LIKE '%sort_scan%';The number of sorts that were done by scanning the table.
grafana
rate(mysql_global_status_sort_scan{instance="$host"}[$interval]) or irate(mysql_global_status_sort_scan{instance="$host"}[5m])Sort Range
SHOW GLOBAL STATUS LIKE '%sort_range%';The number of sorts that were done using ranges.
Sort Merge Passes
SHOW GLOBAL STATUS LIKE '%sort_merge_passes%';The number of merge passes that the sort algorithm has had to do. If this value is large, you should consider increasing the value of the sort_buffer_size system variable.
grafana
rate(mysql_global_status_sort_merge_passes{instance="$host"}[$interval]) or irate(mysql_global_status_sort_merge_passes{instance="$host"}[5m])11. Mysql Slow Query
SHOW GLOBAL STATUS LIKE '%slow_queries%';The number of queries that have taken more than long_query_time seconds. This counter increments regardless of whether the slow query log is enabled. For information about that log, see Section 5.4.5, “The Slow Query Log”.
SHOW GLOBAL VARIABLES LIKE '%long_query_time%';--long-query-time=#long_query_time100If a query takes longer than this many seconds, the server increments the Slow_queries status variable. If the slow query log is enabled, the query is logged to the slow query log file. This value is measured in real time, not CPU time, so a query that is under the threshold on a lightly loaded system might be above the threshold on a heavily loaded one. The minimum and default values of long_query_time are 0 and 10, respectively. The value can be specified to a resolution of microseconds. See Section 5.4.5, “The Slow Query Log”.
Smaller values of this variable result in more statements being considered long-running, with the result that more space is required for the slow query log. For very small values (less than one second), the log may grow quite large in a small time. Increasing the number of statements considered long-running may also result in false positives for the “excessive Number of Long Running Processes” alert in MySQL Enterprise Monitor, especially if Group Replication is enabled. For these reasons, very small values should be used in test environments only, or, in production environments, only for a short period.
grafana
rate(mysql_global_status_slow_queries{instance="$host"}[$interval]) or irate(mysql_global_status_slow_queries{instance="$host"}[5m])12. Mysql Abort Connections
Aborted Connects (attempts)
SHOW GLOBAL STATUS LIKE '%aborted_connects%';For additional connection-related information, check the Connection_errors_*xxx* status variables and the host_cache table.
As of MySQL 5.7.3, Aborted_connects is not visible in the embedded server because for that server it is not updated and is not meaningful.
grafana
rate(mysql_global_status_aborted_connects{instance="$host"}[$interval]) or irate(mysql_global_status_aborted_connects{instance="$host"}[5m])Aborted Clients (timeout)
SHOW GLOBAL STATUS LIKE '%aborted_clients%';The number of connections that were aborted because the client died without closing the connection properly. See Section B.4.2.10, “Communication Errors and Aborted Connections”.
grafana
rate(mysql_global_status_aborted_clients{instance="$host"}[$interval]) or irate(mysql_global_status_aborted_clients{instance="$host"}[5m])13. Mysql Table Lock
Table Locks Immediate
SHOW GLOBAL STATUS LIKE '%table_locks_immediate%';The number of times that a request for a table lock could be granted immediately.
grafana
rate(mysql_global_status_table_locks_immediate{instance="$host"}[$interval]) or irate(mysql_global_status_table_locks_immediate{instance="$host"}[5m])Table Locks Waited
SHOW GLOBAL STATUS LIKE '%table_locks_waited%';The number of times that a request for a table lock could not be granted immediately and a wait was needed. If this is high and you have performance problems, you should first optimize your queries, and then either split your table or tables or use replication.
grafana
rate(mysql_global_status_table_locks_waited{instance="$host"}[$interval]) or irate(mysql_global_status_table_locks_waited{instance="$host"}[5m])14. Mysql Network Traffic
Inbound
SHOW GLOBAL STATUS LIKE '%bytes_receive%';The number of bytes received from all clients.
grafana
rate(mysql_global_status_bytes_received{instance="$host"}[$interval]) or irate(mysql_global_status_bytes_received{instance="$host"}[5m])Outbound
SHOW GLOBAL STATUS LIKE '%bytes_sent%';The number of bytes sent to all clients.
grafana
rate(mysql_global_status_bytes_sent{instance="$host"}[$interval]) or irate(mysql_global_status_bytes_sent{instance="$host"}[5m])15. Mysql Network Usage Hourly
Received
grafana
increase(mysql_global_status_bytes_received{instance="$host"}[1h])Sent
grafana
increase(mysql_global_status_bytes_sent{instance="$host"}[1h])16. Mysql Internal Memory Overview
InnoDB Buffer Pool Data
SHOW GLOBAL STATUS LIKE '%innodb_page_size%';InnoDBSHOW GLOBAL STATUS LIKE '%buffer_pool_pages_data%';2375181*16Kb = 36G
grafana
mysql_global_status_innodb_page_size{instance="$host"} * on (instance) mysql_global_status_buffer_pool_pages{instance="$host",state="data"}17. Top Command Counters
SHOW GLOBAL STATUS LIKE '%Com%';
SHOW GLOBAL STATUS LIKE '%Com_select%';
SHOW GLOBAL STATUS LIKE '%Com_set_option%';
SHOW GLOBAL STATUS LIKE '%Com_commit%';
SHOW GLOBAL STATUS LIKE '%Com_update%';
SHOW GLOBAL STATUS LIKE '%Com_insert%';
SHOW GLOBAL STATUS LIKE '%Com_admin_commands%';
SHOW GLOBAL STATUS LIKE '%Com_insert_select%';Com_*`xxx`*Com_**xxxCom_deleteCom_updateCom_delete_multiCom_update_multiCom_selectCom_stmt_**Com_shutdowngrafana
topk(5, rate(mysql_global_status_commands_total{instance="$host"}[$interval])>0) or topk(5, irate(mysql_global_status_commands_total{instance="$host"}[5m])>0)18. Top Command Counters Hourly
grafana
topk(5, increase(mysql_global_status_commands_total{instance="$host"}[1h])>0)19. Mysql Handler
SHOW GLOBAL STATUS LIKE '%handler_%';grafana
rate(mysql_global_status_handlers_total{instance="$host", handler!~"commit|rollback|savepoint.*|prepare"}[$interval]) or irate(mysql_global_status_handlers_total{instance="$host", handler!~"commit|rollback|savepoint.*|prepare"}[5m])20. Mysql Transaction Handler
SHOW GLOBAL STATUS LIKE '%handler_commit%';
SHOW GLOBAL STATUS LIKE '%handler_prepare%';
SHOW GLOBAL STATUS LIKE '%handler_rollback%';
The number of internal COMMIT statements.
A counter for the prepare phase of two-phase commit operations.
The number of requests for a storage engine to perform a rollback operation.
The number of requests for a storage engine to place a savepoint.
grafana
rate(mysql_global_status_handlers_total{instance="$host", handler=~"commit|rollback|savepoint.*|prepare"}[$interval]) or irate(mysql_global_status_handlers_total{instance="$host", handler=~"commit|rollback|savepoint.*|prepare"}[5m])21. Process States
为什么显示不出来呢?
看起来其使用了information_schema这个库
info_schema_processlist.go
processlistCountDesc = prometheus.NewDesc(
		prometheus.BuildFQName(namespace, informationSchema, "threads"),
		"The number of threads (connections) split by current state.",
		[]string{"state"}, nil)
23. Mysql Query Cache Memory
Free Memory
SHOW GLOBAL STATUS LIKE '%qcache_free_memory%';The amount of free memory for the query cache.
Note
The query cache is deprecated as of MySQL 5.7.20, and is removed in MySQL 8.0. Deprecation includes Qcache_free_memory.
grafana
mysql_global_status_qcache_free_memory{instance="$host"}Query Cache Size
SHOW GLOBAL VARIABLES LIKE '%query_cache_size%';--query-cache-size=#query_cache_size10485760184467440737095516154294967295The amount of memory allocated for caching query results. By default, the query cache is disabled. This is achieved using a default value of 1M, with a default for query_cache_type of 0. (To reduce overhead significantly if you set the size to 0, you should also start the server with query_cache_type=0.
The permissible values are multiples of 1024; other values are rounded down to the nearest multiple. For nonzero values of query_cache_size, that many bytes of memory are allocated even if query_cache_type=0. See Section 8.10.3.3, “Query Cache Configuration”, for more information.
The query cache needs a minimum size of about 40KB to allocate its structures. (The exact size depends on system architecture.) If you set the value of query_cache_size too small, a warning will occur, as described in Section 8.10.3.3, “Query Cache Configuration”.
Note
deprecatedgrafana
mysql_global_variables_query_cache_size{instance="$host"}26. Mysql Open Files
Open Files
SHOW GLOBAL STATUS LIKE '%open_files%';The number of files that are open. This count includes regular files opened by the server. It does not include other types of files such as sockets or pipes. Also, the count does not include files that storage engines open using their own internal functions rather than asking the server level to do so.
grafana
mysql_global_status_open_files{instance="$host"}Open Files Limit
SHOW GLOBAL VARIABLES LIKE '%open_files_limit%';--open-files-limit=#open_files_limit5000, with possible adjustment0platform dependentsetrlimit()Too many open filesThe value of open_files_limit at runtime indicates the number of file descriptors actually permitted to mysqld by the operating system, which might differ from the value requested at startup. If the number of file descriptors requested during startup cannot be allocated, mysqld writes a warning to the error log.
The effective open_files_limit value is based on the value specified at system startup (if any) and the values of max_connections and table_open_cache, using these formulas:
10 + max_connections + (table_open_cache * 2)max_connections * 5open_files_limitThe server attempts to obtain the number of file descriptors using the maximum of those values. If that many descriptors cannot be obtained, the server attempts to obtain as many as the system will permit.
The effective value is 0 on systems where MySQL cannot change the number of open files.
On Unix, the value cannot be set greater than ulimit -n.
grafana
mysql_global_variables_open_files_limit{instance="$host"}InnoDB Open Files
SHOW GLOBAL STATUS LIKE '%innodb_num_open_files%';InnoDBgrafana
mysql_global_status_innodb_num_open_files{instance="$host"}27. Mysql Table Open Cache Status
Openings
SHOW GLOBAL STATUS LIKE '%opened_tables%';The number of tables that are open.
grafana
rate(mysql_global_status_opened_tables{instance="$host"}[$interval]) or irate(mysql_global_status_opened_tables{instance="$host"}[5m])Hits
SHOW GLOBAL STATUS LIKE '%table_open_cache_hits%';The number of hits for open tables cache lookups.
grafana
rate(mysql_global_status_table_open_cache_hits{instance="$host"}[$interval]) or irate(mysql_global_status_table_open_cache_hits{instance="$host"}[5m])Misses
SHOW GLOBAL STATUS LIKE '%table_open_cache_misses%';The number of misses for open tables cache lookups.
grafana
rate(mysql_global_status_table_open_cache_misses{instance="$host"}[$interval]) or irate(mysql_global_status_table_open_cache_misses{instance="$host"}[5m])Misses due to Overflows
SHOW GLOBAL STATUS LIKE '%table_open_cache_overflows%';The number of overflows for the open tables cache. This is the number of times, after a table is opened or closed, a cache instance has an unused entry and the size of the instance is larger than table_open_cache / table_open_cache_instances.
grafana
rate(mysql_global_status_table_open_cache_overflows{instance="$host"}[$interval]) or irate(mysql_global_status_table_open_cache_overflows{instance="$host"}[5m])Table Open Cache Hit Ratio
grafana
(rate(mysql_global_status_table_open_cache_hits{instance="$host"}[$interval]) or irate(mysql_global_status_table_open_cache_hits{instance="$host"}[5m]))/((rate(mysql_global_status_table_open_cache_hits{instance="$host"}[$interval]) or irate(mysql_global_status_table_open_cache_hits{instance="$host"}[5m]))+(rate(mysql_global_status_table_open_cache_misses{instance="$host"}[$interval]) or irate(mysql_global_status_table_open_cache_misses{instance="$host"}[5m])))28. Mysql Open Tables
Open Tables
Openings表示的是rate 这里是总量
grafana
mysql_global_status_open_tables{instance="$host"}Table Open Cache
SHOW GLOBAL VARIABLES LIKE '%table_open_cache%';--table-open-cache=#table_open_cache20001524288The number of open tables for all threads. Increasing this value increases the number of file descriptors that mysqld requires. You can check whether you need to increase the table cache by checking the Opened_tables status variable. See Section 5.1.9, “Server Status Variables”. If the value of Opened_tables is large and you do not use FLUSH TABLES often (which just forces all tables to be closed and reopened), then you should increase the value of the table_open_cache variable. For more information about the table cache, see Section 8.4.3.1, “How MySQL Opens and Closes Tables”.
grafana
mysql_global_variables_table_open_cache{instance="$host"}29. Mysql Table Definition Cache
Opened Table Definitions(right-y)
SHOW GLOBAL STATUS LIKE '%opened_table_definitions%';.frmgrafana
rate(mysql_global_status_opened_table_definitions{instance="$host"}[$interval]) or irate(mysql_global_status_opened_table_definitions{instance="$host"}[5m])Table Definitions Cache Size
SHOW GLOBAL VARIABLES LIKE '%table_definition_cache%';--table-definition-cache=#table_definition_cache-1400524288.frm400 + (table_open_cache / 2)InnoDBInnoDBAdditionally, table_definition_cache defines a soft limit for the number of InnoDB file-per-table tablespaces that can be open at one time, which is also controlled by innodb_open_files. If both table_definition_cache and innodb_open_files are set, the highest setting is used. If neither variable is set, table_definition_cache, which has a higher default value, is used. If the number of open tablespace file handles exceeds the limit defined by table_definition_cache or innodb_open_files, the LRU mechanism searches the tablespace file LRU list for files that are fully flushed and are not currently being extended. This process is performed each time a new tablespace is opened. If there are no “inactive” tablespaces, no tablespace files are closed.
grafana
mysql_global_variables_table_definition_cache{instance="$host"}Open Table Definitions
总量
grafana
mysql_global_status_open_table_definitions{instance="$host"}3. 对主从复制进行监控
4. 对服务器资源的监控,如磁盘空间


